In Webi, a cross tab (AKA, Cross Table) will enable the display the joint distribution of multiple dimensions by tabulating the values for their measures one against the other. Cross tabs are widely used to find inter-relationships and interactions between measure values.
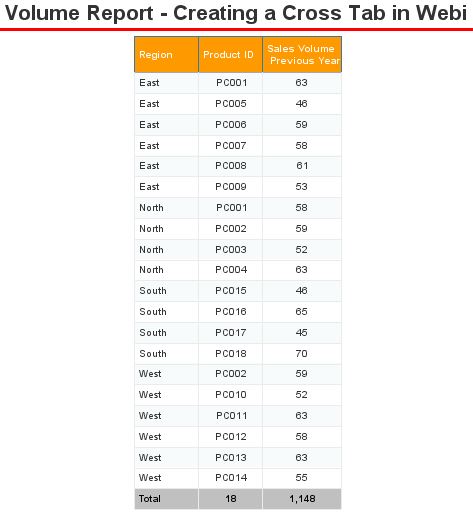
Consider the table below containing sales volume for products based on four regions (I.e. East, North, South, and West).
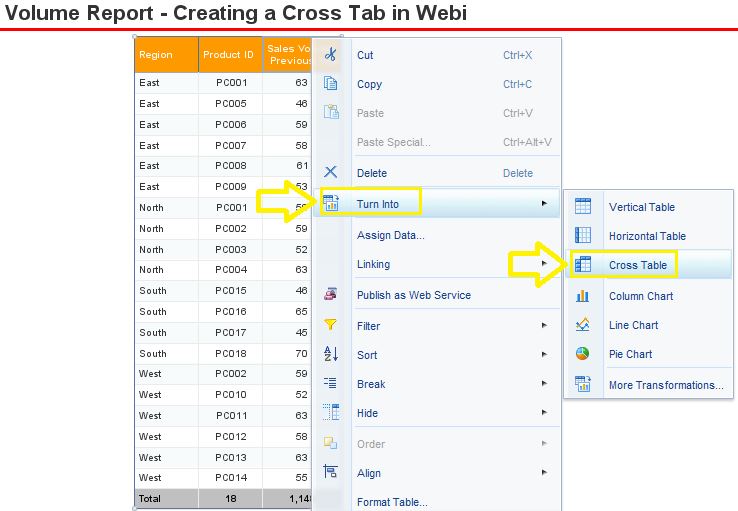
In order to create a cross tab out of this table just select the top corner of the table until the four arrow symbol appears and then right click on it and go to “Turn Into” > ”Cross Tab”.
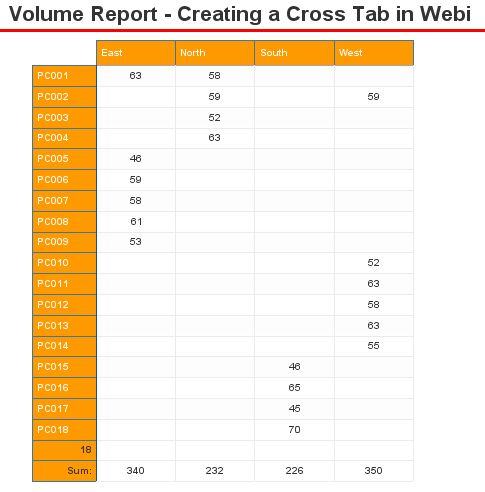
Here is the cross tab view.
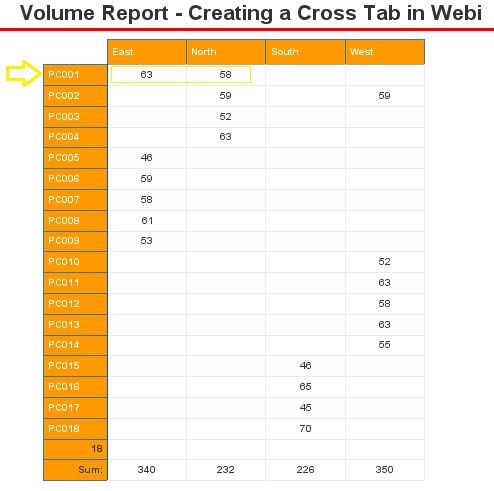
This Cross Tab provides us with an all-inclusive view of all sales in the four regions. As such, some details which were not easily transparent in the former view are vividly apparent here. for example, in the cross tab view we could easily observe that the product PC001 has sales in both East and North regions, whereas; finding this out in the normal table view would require some further investigation and is not as transparent.
0 Comments
Your comment will be posted after it is approved.
Leave a Reply. |
CategoriesArchives
June 2020
|


