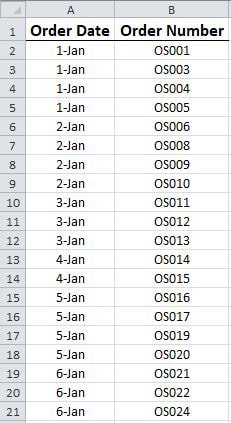
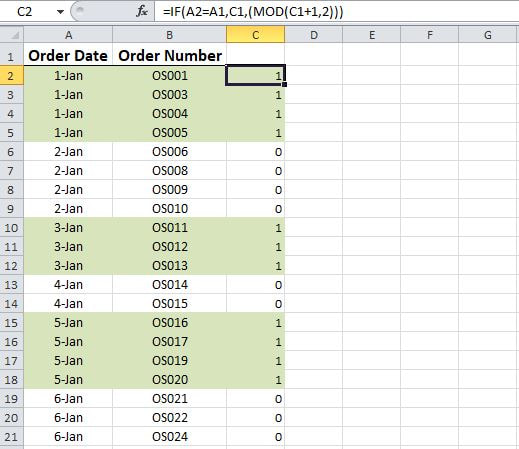
Last week I demonstrated how to highlight rows whenever cell values change in a data set. Today I will illustrate how to highlight alternate groupings of data in a data set. Consider the data set below.
Our objective is to highlight discontinuous groups of data based on values in Column A.
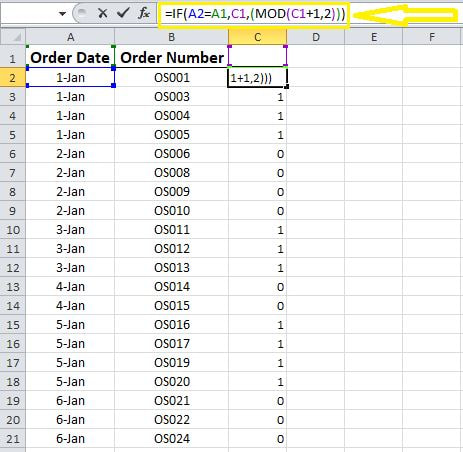
STEP 1] Enter the formula below in any given column and make sure that the cell above the first entry of this formula is blank. This new column will act as a helper column. = IF(A2=A1,C1,(MOD(C1+1,2)))
Note] this MOD formula will return the remainder after one number is divided by the other. That said, the formula above will generate 1s or 0s consecutively as the values in Column A alternate.
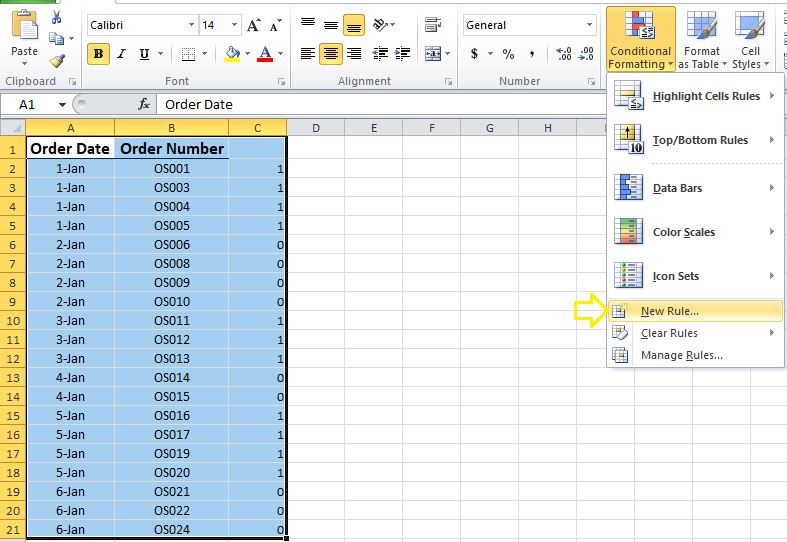
STEP 2] select the data range in mind and GO to “Home”> “Conditional Formatting” >”New Rule”
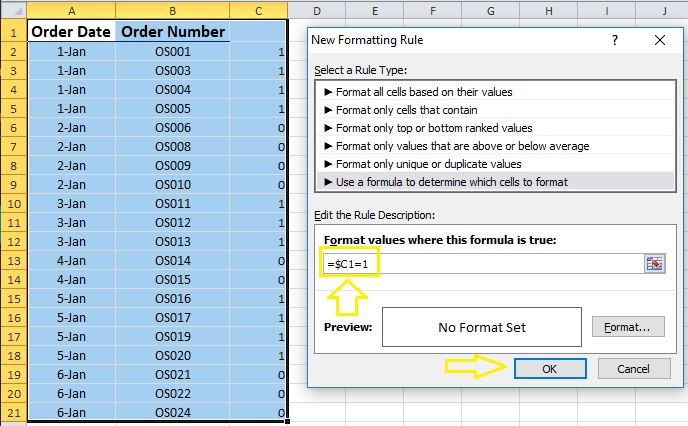
Step 3] Type in the following formula:
=$C1 =1 Note] Make sure to reference the empty cell above the first row in which the formula has been inserted, otherwise; the formatting will not be accurate.
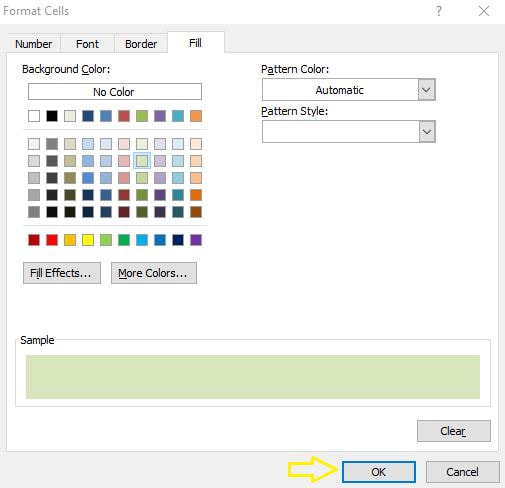
STEP 4] Go to format and select the color you have in mind in the “Fill” tab.
STEP 5] Click “OK” twice. Here is the desired outcome.
Hide the helper column if no longer needed.
0 Comments
Your comment will be posted after it is approved.
Leave a Reply. |
CategoriesArchives
June 2020
|

