WISDOMBYDATA
  • BLOG
    • Blog Guide
    • Blog History
  • EXCEL
    • Functions & Formulas
    • VBA & Macros
    • VLOOKUP
    • Pivot Tables
    • Conditional Formatting
    • Tricks & Shortcuts
  • BI
    • SAP BOBJ/BW
    • Tableau
  • SQL
  • ABOUT
    • About WBD
    • About Me

How to add data labels to select elements in a Webi graph

11/20/2016

1 Comment


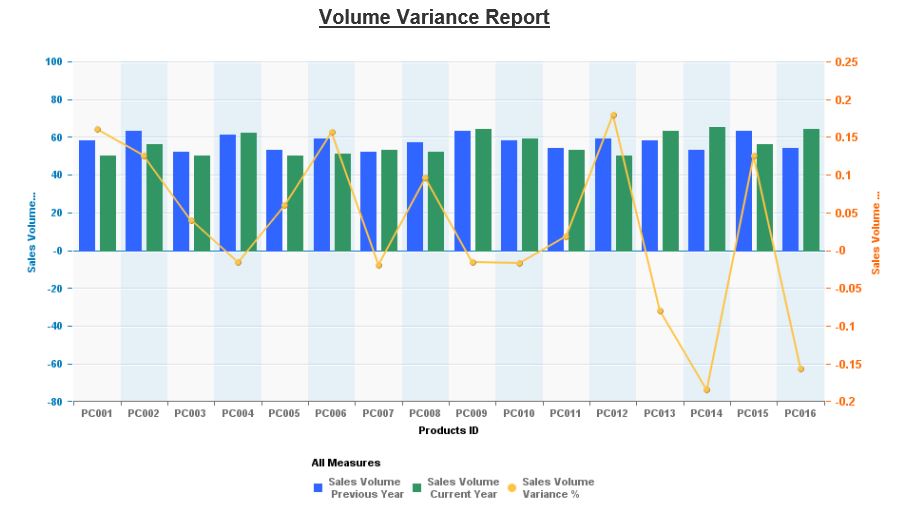
​Consider the table below, a “Dual Axis Column and Line” graph in a Webi report within SAP BusinessObjects.
Picture
​Let’s say we have a requirement to add data labels only to the line element of the graph (i.e. Sales Volume Variance %) and data labels are NOT required for any of the two vertical bar elements. Let’s see how we could do this: 
Picture
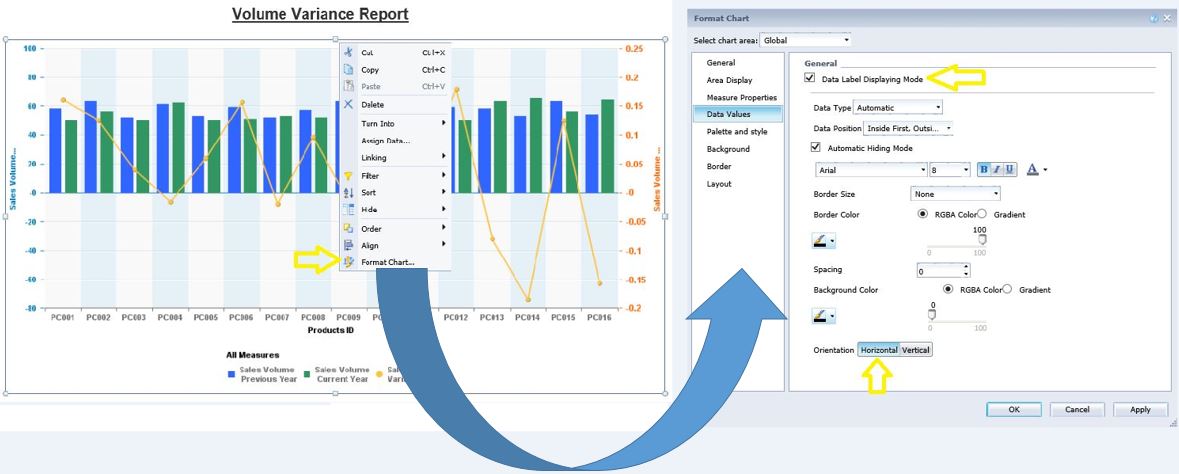
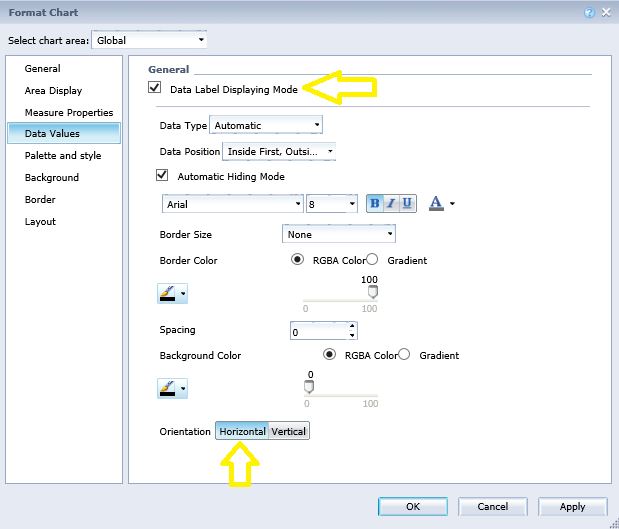
As depicted in the screenshot above, I will right click on the report and go to “Format Chart” > “Data Values” and then select “Data Label Displaying Mode”. I will also selected the “Horizontal” orientation in the bottom prior to applying and clicking “OK”

As you could observe data values have been added for all graph elements including the two column elements: 
Picture
Here is how we could limit data labels to a particular element or elements in a Webi Graph:
​
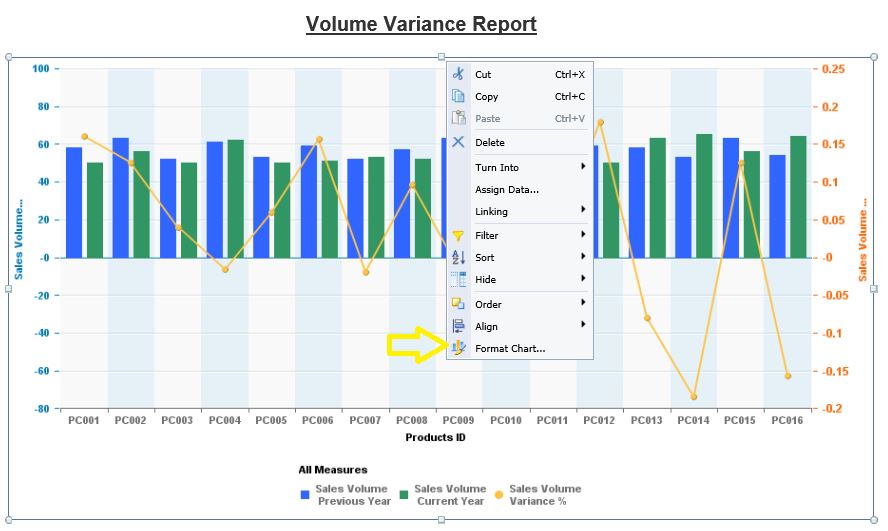
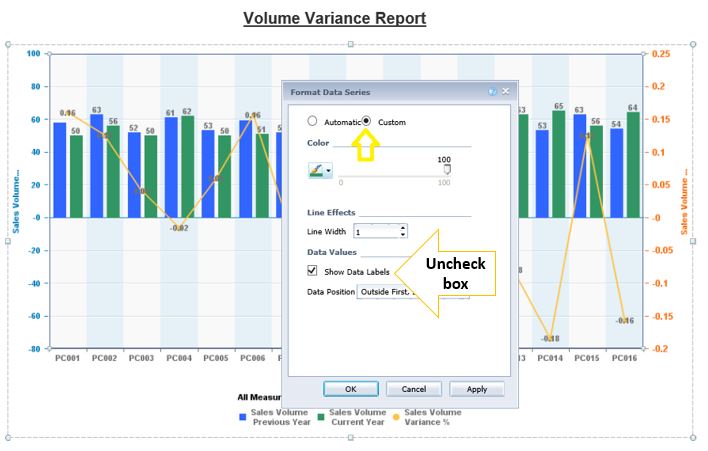
STEP 1] Right click on the desired graph element (in this case the column element) and select “Format Data Series”.
Picture
STEP 2] Select the “Custom” radio button and then uncheck the “show data labels” box. Perform this step for all the graph elements for which a data label in NOT required. 
Picture
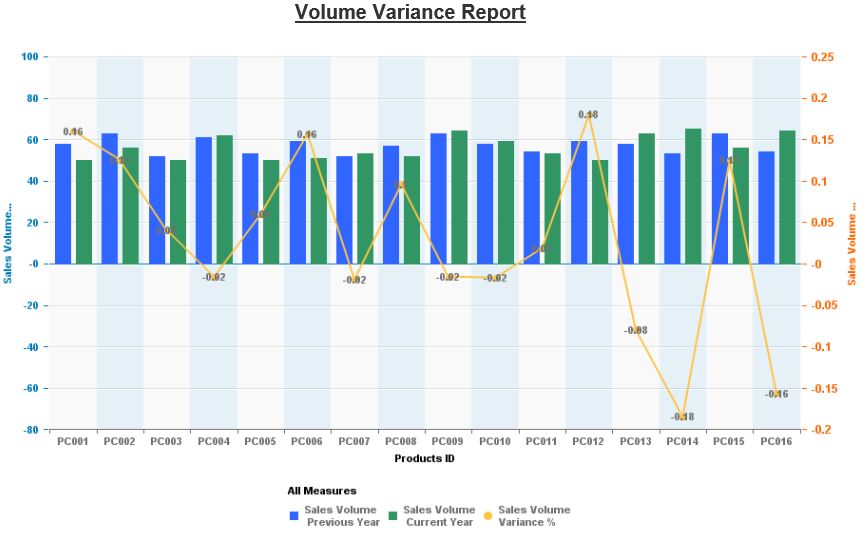
​The screenshot below illustrates the desired outcome in which data labels are only represented for the single line element. 
Picture

1 Comment
Luke
3/19/2018 06:12:25 pm

nice answer, so simple but would have been a bit of head-scratching for me... It's easy when you know how! :)

Reply

Your comment will be posted after it is approved.


Leave a Reply.

    Categories

    All
    BI
    EXCEL
    MISC
    SQL

    Archives

    June 2020
    May 2020
    April 2020
    March 2020
    February 2020
    December 2019
    November 2019
    October 2019
    September 2019
    August 2019
    July 2019
    June 2019
    May 2019
    April 2019
    March 2019
    February 2019
    January 2019
    December 2018
    November 2018
    October 2018
    September 2018
    August 2018
    July 2018
    June 2018
    May 2018
    April 2018
    March 2018
    September 2017
    August 2017
    July 2017
    June 2017
    May 2017
    April 2017
    March 2017
    February 2017
    January 2017
    December 2016
    November 2016
    October 2016
    September 2016
    August 2016
    July 2016
    June 2016
    May 2016
    April 2016
    March 2016
    February 2016
    May 2015
    April 2015
    March 2015
    February 2015
    January 2015
    December 2014
    November 2014
    October 2014
    September 2014
    August 2014
    April 2014
    March 2014
    February 2014
    January 2014
    December 2013
    November 2013

Powered by Create your own unique website with customizable templates.
  • BLOG
    • Blog Guide
    • Blog History
  • EXCEL
    • Functions & Formulas
    • VBA & Macros
    • VLOOKUP
    • Pivot Tables
    • Conditional Formatting
    • Tricks & Shortcuts
  • BI
    • SAP BOBJ/BW
    • Tableau
  • SQL
  • ABOUT
    • About WBD
    • About Me