|
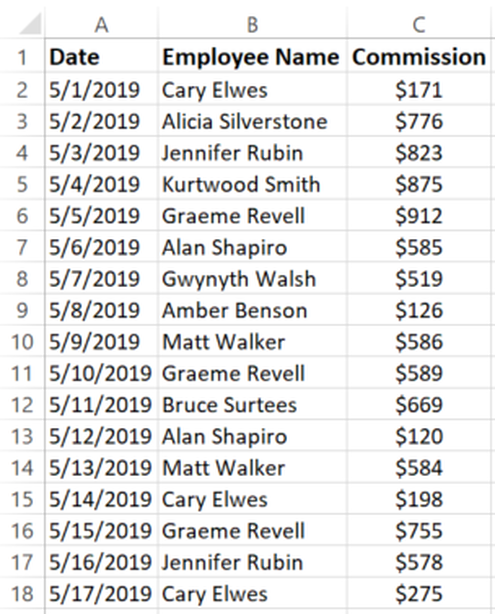
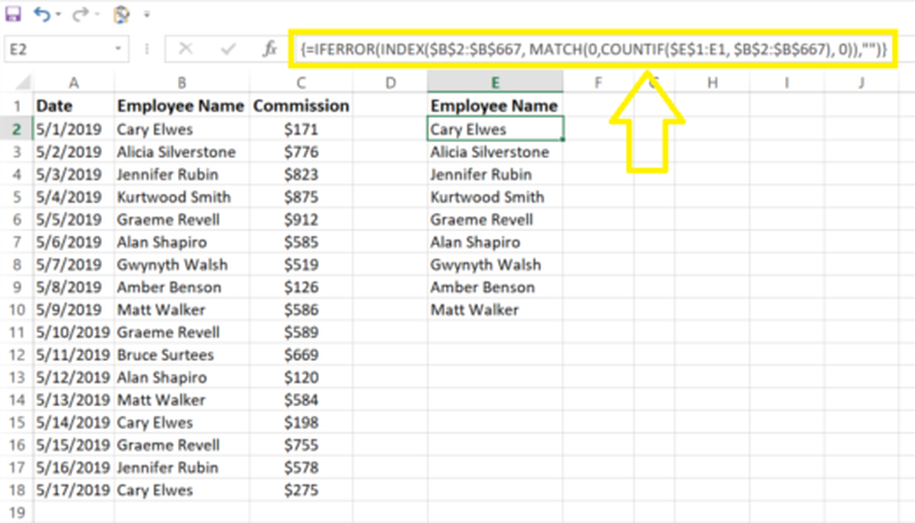
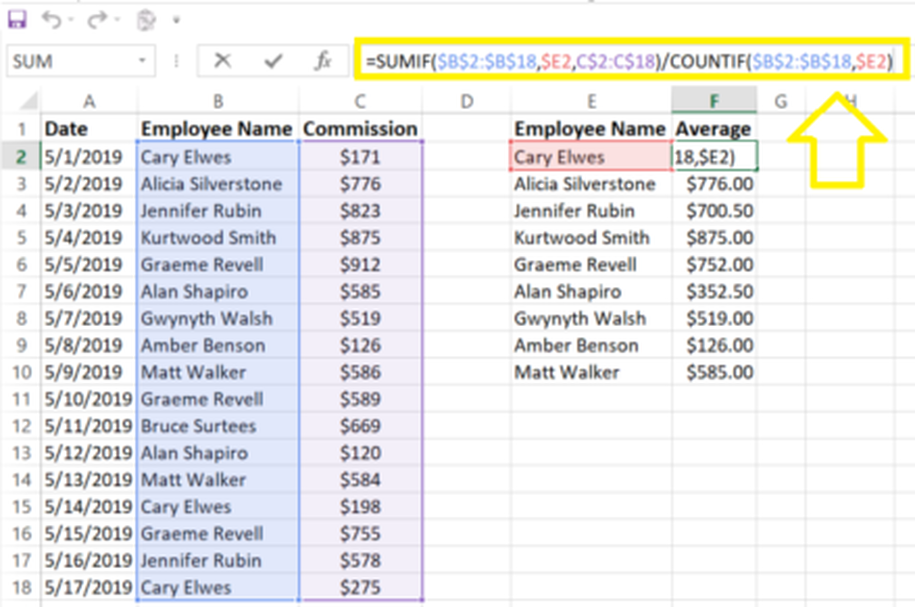
Last week I demonstrated how to get a dynamic list of unique values in MS Excel. Today, I want to show how to also calculate averages (or other relevant statistics) for each unique value. Consider the table below containing a list of employees and their commissions earned on various different dates. Here is how to get the average commission earned per unique employee from this list: STEP 1] use the formula from my last blog post in order to get a dynamic list of unique values from the table above. {=IFERROR(INDEX($B$2:$B$667, MATCH(0,COUNTIF($F$1:F1, $B$2:$B$667), 0)),"")} STEP 2] Use the following formula to calculate the average for each unique record. =SUMIF($B$2:$B$18,$E2,C$2:C$18)/COUNTIF($B$2:$B$18,$E2) This formula first sums the values in that list that corresponds to the unique records i.e. SUMIF($B$2:$B$18,$E2,C$2:C$18) then the second part of the formula divides that number by the number of times that unique record has been repeated in the original table i.e. COUNTIF($B$2:$B$18,$E2)
0 Comments
Leave a Reply. |
CategoriesArchives
June 2020
|


